Property Prices in Belgium | All Municipalities
Explore property prices across all 581 Belgian municipalities: median prices, price per m², trends and neighborhood scores.
Source : Statbel|September 2026
Prices municipality by municipality
The usual price in each municipality. Click one to see the details.
Usual price of a houseUsual price of a flatunder €150,000€150,000 to €250,000€250,000 to €350,000€350,000 to €450,000over €450,000too few sales
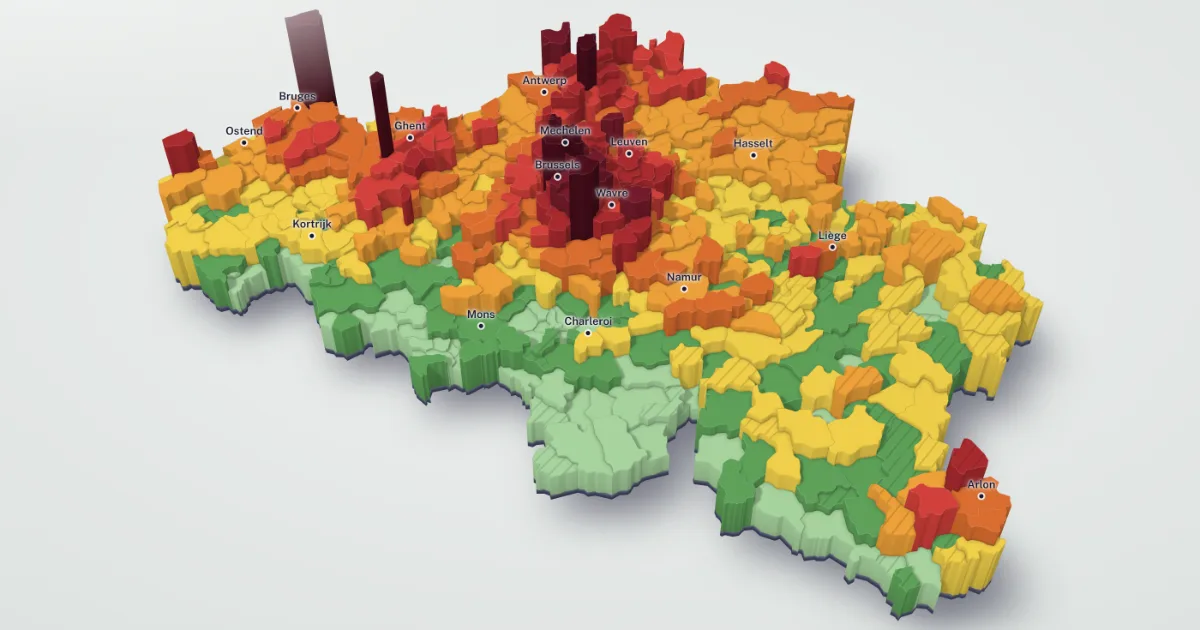
Belgium's price map in 3D
All 581 Belgian municipalities in 3D, by the median price of houses and apartments, from 2010 to 2026. Move through the years, find your municipality and compare it with its neighbours.
See the price map585 municipalities
| Municipality | Score |
|---|---|
| Antwerp€377,500 | 70/100 |
| Ghent€388,500 | 72/100 |
| Charleroi€150,000 | 75/100 |
| Brussels€415,000 | 81/100 |
| Liege€190,500 | 77/100 |
| Schaerbeek€604,000 | 74/100 |
| Anderlecht€372,500 | 82/100 |
| Bruges€360,000 | 76/100 |
| Namur€259,000 | 77/100 |
| Louvain€474,000 | 74/100 |
| Molenbeek-Saint-Jean€363,750 | 72/100 |
| Mons€180,000 | 73/100 |
| Aalst€290,000 | 68/100 |
| Mechelen€375,000 | 75/100 |
| Ixelles€815,000 | 69/100 |
| Uccle€618,000 | 80/100 |
| Sint-Niklaas€305,500 | 76/100 |
| La Louviere€180,000 | 59/100 |
| Hasselt€309,500 | 57/100 |
| Courtrai€266,000 | 69/100 |
| Ostend€304,500 | 66/100 |
| Tournai€190,000 | 82/100 |
| Genk€265,000 | 63/100 |
| Roulers€255,000 | 74/100 |
| Seraing€186,000 | 68/100 |
| Woluwe-Saint-Lambert€655,000 | 70/100 |
| Mouscron€187,750 | 62/100 |
| Forest€497,500 | 67/100 |
| Verviers€215,000 | 70/100 |
| Jette€425,000 | 76/100 |
| Beveren€330,000 | 62/100 |
| Etterbeek€766,000 | 69/100 |
| Saint-Gilles€550,000 | 72/100 |
| Beringen€292,500 | 61/100 |
| Vilvoorde€379,500 | 57/100 |
| Turnhout€297,500 | 78/100 |
| Termonde€282,500 | 64/100 |
| Deinze€312,500 | 58/100 |
| Evere€460,000 | 66/100 |
| Dilbeek€420,000 | 52/100 |
| Heist-op-den-Berg€405,100 | 67/100 |
| Lokeren€327,000 | 66/100 |
| Halle€358,000 | 65/100 |
| Woluwe-Saint-Pierre€730,000 | 78/100 |
| Geel€325,000 | 65/100 |
| Sint-Truiden€275,000 | 68/100 |
| Herstal€183,500 | 54/100 |
| Braine-l'Alleud€420,000 | 61/100 |
| Ninove€275,000 | 62/100 |
| Maasmechelen€260,000 | 59/100 |
Municipalities by province
FAQ
The median house price in Belgium is approximately 270,000 EUR in 2026. This varies significantly by region: Brussels is the most expensive, followed by Flanders and Wallonia. Check our municipality pages for exact prices per commune.
Our prices are based on official Statbel statistics (Belgian Statistical Office). They include median prices from actual transactions, updated quarterly. Median prices are more reliable than averages as they are less influenced by extreme values.
Brussels has the highest property prices due to urban density and international demand. Flanders follows with strong economic activity. Wallonia generally offers lower prices, except for Walloon Brabant. Registration duties also differ: 12.5% in Wallonia and Brussels, 3% in Flanders (standard rate).
Price data is updated quarterly based on Statbel publications. Neighborhood scores and EPC data are reviewed monthly. Each municipality page shows the date of the last update.
Yes, use our comparison tool to view two municipalities side by side: prices, neighborhood scores, EPC distribution and demographics. You can also use the free estimation tool for a personalized estimate.
Our data provides a good indication of local market levels, but each property is unique. Factors such as condition, renovation, EPC label, location and surface area influence the final price. Use our AI estimation tool for a personalized indication.
Methodology
Property prices on Immolytics come from Statbel (notarial deeds, CC BY 4.0), published quarterly. Neighborhood scores are calculated from real OpenStreetMap points of interest (1-3 km radius). Climate data: Open-Meteo. Rail transport: iRail. Air quality: AQICN.
View Statbel data Data under CC BY 4.0 license
Data source: Statbel (Statistics Belgium)