Property Prices Flemish Brabant 2026
Discover property prices in Flemish Brabant: median prices, cheapest and most expensive municipalities, and price trends. 65 municipalities analyzed.
€399,000
€299,000
65
The price map, municipality by municipality
Each municipality takes the colour of the usual price of a house, based on the latest sales published by Statbel. Click a municipality to see all its prices.
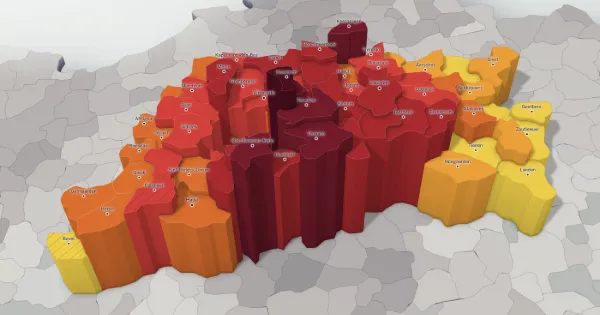
The price map of the province of Flemish Brabant
All 65 municipalities of the province of Flemish Brabant in 3D, by the median price of their houses and apartments, from 2010 to 2026. Find a municipality and compare it with its neighbours.
See the province on the mapThe property price barometer of the province of Flemish Brabant, Q2 2026
Top 10 cheapest municipalities in Flemish Brabant
| # | Municipality | Median house |
|---|---|---|
| 1 | Tirlemont | €260,000 |
| 2 | Kortenaken | €260,000 |
| 3 | Bever | €262,500 |
| 4 | Landen | €269,000 |
| 5 | Diest | €275,000 |
| 6 | Scherpenheuvel-Zichem | €275,000 |
| 7 | Hoegaarden | €280,000 |
| 8 | Geetbets | €300,000 |
| 9 | Gooik | €302,500 |
| 10 | Galmaarden | €302,500 |
Top 10 most expensive municipalities in Flemish Brabant
| # | Municipality | Median house |
|---|---|---|
| 1 | Wezembeek-Oppem | €625,000 |
| 2 | Rhode-Saint-Genese | €600,000 |
| 3 | Overijse | €585,000 |
| 4 | Tervuren | €560,500 |
| 5 | Kraainem | €550,000 |
| 6 | Keerbergen | €544,000 |
| 7 | Boortmeerbeek | €543,750 |
| 8 | Hoeilaart | €495,000 |
| 9 | Oud-Heverlee | €480,500 |
| 10 | Kampenhout | €475,000 |
All municipalities in Flemish Brabant
| Municipality | House | Apartment |
|---|---|---|
| Louvain | €474,000 | €318,750 |
| Vilvoorde | €379,500 | €270,000 |
| Dilbeek | €420,000 | €290,500 |
| Halle | €358,000 | €270,000 |
| Grimbergen | €400,000 | €279,500 |
| Zaventem | €445,000 | €274,500 |
| Tirlemont | €260,000 | €239,000 |
| Sint-Pieters-Leeuw | €353,500 | €281,000 |
| Asse | €375,000 | €250,000 |
| Aarschot | €349,500 | €289,000 |
| Beersel | €405,000 | €265,000 |
| Overijse | €585,000 | €325,000 |
| Diest | €275,000 | €265,000 |
| Scherpenheuvel-Zichem | €275,000 | €290,000 |
| Zemst | €456,000 | €299,000 |
| Tervuren | €560,500 | €320,000 |
| Herent | €380,000 | €365,000 |
| Kortenberg | €447,500 | €312,500 |
| Meise | €377,500 | €299,500 |
| Londerzeel | €392,500 | €320,000 |
| Rhode-Saint-Genese | €600,000 | €327,500 |
| Wemmel | €399,000 | €305,000 |
| Merchtem | €341,500 | €307,500 |
| Rotselaar | €475,000 | €330,000 |
| Ternat | €365,000 | N/A |
| Machelen | €348,000 | €292,000 |
| Landen | €269,000 | €200,000 |
| Haacht | €397,500 | €227,500 |
| Tremelo | €449,000 | €308,500 |
| Lubbeek | €472,500 | €293,250 |
| Opwijk | €322,000 | €240,000 |
| Wezembeek-Oppem | €625,000 | €402,500 |
| Liedekerke | €308,500 | €245,500 |
| Kraainem | €550,000 | €382,500 |
| Affligem | €340,000 | €307,000 |
| Boortmeerbeek | €543,750 | N/A |
| Keerbergen | €544,000 | €400,000 |
| Steenokkerzeel | €415,000 | N/A |
| Kampenhout | €475,000 | €332,500 |
| Roosdaal | €387,500 | N/A |
| Hoeilaart | €495,000 | €338,100 |
| Tielt-Winge | €398,000 | €324,500 |
| Oud-Heverlee | €480,500 | €349,000 |
| Begijnendijk | €400,000 | €250,000 |
| Bierbeek | €470,000 | €405,000 |
| Bertem | €451,054 | N/A |
| Holsbeek | €417,500 | €323,000 |
| Huldenberg | €457,500 | N/A |
| Kapelle-op-den-Bos | €392,000 | N/A |
| Gooik | €302,500 | €275,000 |
| Lennik | €403,000 | N/A |
| Galmaarden | €302,500 | €275,000 |
| Zoutleeuw | €377,500 | N/A |
| Boutersem | €450,000 | €363,552 |
| Kortenaken | €260,000 | N/A |
| Linter | €377,500 | N/A |
| Hoegaarden | €280,000 | €304,000 |
| Herne | €302,500 | €275,000 |
| Bekkevoort | €315,000 | N/A |
| Geetbets | €300,000 | N/A |
| Drogenbos | €419,500 | €285,000 |
| Glabbeek | €425,000 | N/A |
| Linkebeek | €455,000 | €269,000 |
| Pepingen | €412,500 | N/A |
| Bever | €262,500 | N/A |
Other regions and provinces
FAQ
Methodology
Property prices on Immolytics come from Statbel (notarial deeds, CC BY 4.0), published quarterly. Neighborhood scores are calculated from real OpenStreetMap points of interest (1-3 km radius). Climate data: Open-Meteo. Rail transport: iRail. Air quality: AQICN.
Data source: Statbel (Statistics Belgium)