Answer three questions and your price range shows straight away, based on sales in Oudsbergen. One of the best agencies in the area can then confirm it at your home, free of charge.
1You ask for a visitTwo minutes: your name, your number, and when it suits you.
2An agency calls youJust one: one of the best estate agencies in your area, suited to your property. It calls you at the time you chose.
3It comes to your homeIt looks at everything and gives you a price. It is free, and you sign nothing unless you want to.
Immolytics earns no commission on the sale of your property.
How to estimate a house price in Oudsbergen
Everything starts from the median price of Oudsbergen for this type of property, shown above. Four things then push it up or down.
01Surface and number of bedrooms: a house larger than the municipality's average is worth more, and the reverse.
02Condition: a property to renovate sells well below the median, a recently renovated one above.
03The EPC rating: a poor letter weighs on the bills and on the negotiation.
04The street, the light, the view, recent works: none of that appears in any statistic. Only a visit sees it.
This calculation gives a range, not a price. For the real price, an agency comes to you for free: that is the form just above.
What are homes worth here?
Houses
Median house price
€347,000
In Oudsbergen, half of the houses sold for less than €347,000 and half for more.
Median of the municipalities in the province: €330,000
Median of Flemish municipalities: €350,000
Among its neighbours, Oudsbergen ranks 3 out of 8, from the highest value to the lowest.
Source: Statbel, first half of 2026
Flats
Median flat price
€310,000
In Oudsbergen, half of the flats sold for less than €310,000 and half for more.
Median of the municipalities in the province: €264,750
Median of Flemish municipalities: €275,000
Among its neighbours, Oudsbergen ranks 1 out of 4, from the highest value to the lowest.
Source: Statbel, 2025
Trend
One-year change in house prices
+8.4%
The median house price rose by 8.4% in a year.
Median of the municipalities in the province: +7.8%
Median of Flemish municipalities: +5.2%
Among its neighbours, Oudsbergen ranks 3 out of 7, from the highest value to the lowest.
Source: Statbel, first half of 2026
Living here
Living in Oudsbergen, day to day
Schools, transport, climate, neighbours, home insulation: what the municipality offers once the boxes are unpacked.
What state is the housing in?
Age
When were the homes built?
5.9% Fewer than one in ten houses and buildings in Oudsbergen dates from before 1945.
Each bar shows the share of houses and buildings in Oudsbergen built in that period; the gold line, the median of Flemish municipalities.
Share of houses and buildings in Oudsbergen by construction period
Period
Oudsbergen
Median of Flemish municipalities
Built before 1900
0.9%
5.3%
Built from 1900 to 1918
0.8%
3.7%
Built from 1919 to 1945
4.2%
11.9%
Built from 1946 to 1961
12.1%
13.3%
Built from 1962 to 1970
13.0%
10.6%
Built from 1971 to 1981
20.0%
15.2%
Built from 1982 to 1991
12.2%
9.5%
Built from 1992 to 2001
14.8%
10.1%
Built from 2002 to 2011
11.4%
8.2%
Built after 2011
10.6%
9.5%
Source: Statbel, building stock, 2025
Energy (EPC)
Energy certificates in the municipality
The Flemish Region does not publish the breakdown of energy performance certificates by municipality. We therefore show no figure for Oudsbergen rather than an estimate.
Among its neighbours, Oudsbergen ranks 2 out of 8, from the highest value to the lowest.
Source: SNCB, De Lijn, TEC and STIB (GTFS timetables), 2026
Public transport stops
67.9 per 10,000 residents
For every 10,000 residents, the municipality has 67.9 bus, tram, metro or train stops.
Median of the municipalities in the province: 70.1 per 10,000 residents
Median of Flemish municipalities: 46.9 per 10,000 residents
Among its neighbours, Oudsbergen ranks 4 out of 8, from the highest value to the lowest.
Source: SNCB, De Lijn, TEC and STIB (GTFS timetables), 2026
What is there for families?
Schools
Schools
12
Oudsbergen has 12 schools, from nursery to higher education.
Median of the municipalities in the province: 9
Median of Flemish municipalities: 7
Among its neighbours, Oudsbergen ranks 5 out of 8, from the highest value to the lowest.
Source: Wallonia-Brussels Federation and Onderwijs Vlaanderen, 2026
Nursery and primary schools
12
Oudsbergen has 12 nursery or primary schools.
Median of the municipalities in the province: 6
Median of Flemish municipalities: 6
Among its neighbours, Oudsbergen ranks 3 out of 8, from the highest value to the lowest.
Source: Wallonia-Brussels Federation and Onderwijs Vlaanderen, 2026
Schools per 10,000 residents
5.0 per 10,000 residents
For every 10,000 residents, the municipality has 5.0 schools.
Median of the municipalities in the province: 5.0 per 10,000 residents
Median of Flemish municipalities: 4.6 per 10,000 residents
Among its neighbours, Oudsbergen ranks 5 out of 8, from the highest value to the lowest.
Source: Wallonia-Brussels Federation and Onderwijs Vlaanderen, 2026
Is it safe?
Burglaries
Home burglaries
2.3 per 1,000 homes
From 2022 to 2024, the police recorded an average of 2.3 home burglaries a year per 1,000 homes in Oudsbergen.
Median of Flemish municipalities: 4.2 per 1,000 homes
Source: Federal Police, police crime statistics, 2022 to 2024
Recorded offences
Change in offences recorded by the police
-5%
From 2016 to 2024, the number of offences recorded by the police in Oudsbergen fell by 5%.
Median of Flemish municipalities: +2%
Source: Federal Police, 2016 to 2024
What is the environment like here?
Climate
Average temperature
10.7 °C
Over a year, the average temperature in Oudsbergen is 10.7 °C.
Median of the municipalities in the province: 10.8 °C
Median of Flemish municipalities: 10.9 °C
Among its neighbours, Oudsbergen ranks 4 out of 8, from the highest value to the lowest.
Source: Royal Meteorological Institute, 1991 to 2020
Sunshine
1,694 hours a year
The sun shines on average 1,694 hours a year in Oudsbergen.
Median of the municipalities in the province: 1,709 hours a year
Median of Flemish municipalities: 1,731 hours a year
Among its neighbours, Oudsbergen ranks 5 out of 8, from the highest value to the lowest.
Source: Royal Meteorological Institute, 1991 to 2020
Rainfall
829 mm a year
On average, 829 millimetres of rain fall each year in Oudsbergen.
Median of the municipalities in the province: 809 mm a year
Median of Flemish municipalities: 829 mm a year
Among its neighbours, Oudsbergen ranks 2 out of 8, from the highest value to the lowest.
Source: Royal Meteorological Institute, 1991 to 2020
Air quality
Nitrogen dioxide in the air (NO2)
8.2 µg/m³
Where the residents of Oudsbergen live, the air contains on average 8.2 µg/m³ of nitrogen dioxide. The World Health Organization recommends staying below 10 µg/m³ over the year.
Median of the municipalities in the province: 8.8 µg/m³
Median of Flemish municipalities: 10.2 µg/m³
Among its neighbours, Oudsbergen ranks 5 out of 7, from the highest value to the lowest.
Where the residents of Oudsbergen live, the air contains on average 8.6 µg/m³ of fine particles. The World Health Organization recommends staying below 5 µg/m³ over the year.
Median of the municipalities in the province: 8.2 µg/m³
Median of Flemish municipalities: 8.3 µg/m³
Among its neighbours, Oudsbergen ranks 1 out of 7, from the highest value to the lowest.
Source: FASE 2026 (Wallonia-Brussels Federation) and Onderwijs Vlaanderen
Public Transport
Total stops
162
Transit density
67.8
stops per 10,000 pop.
Bus stops
162
Source: GTFS Belgium, SNCB, De Lijn, TEC, STIB (CC BY 4.0)
Who lives here?
23,875Population+1.5 % over five years
366Population densityinhabitants per km²
9,954HouseholdsAverage household size : 2.4
6.7 %Foreign population
Age distribution
Income and jobs
€31,610Median income+58.1 % National comparison
2,767Enterprises115.9 per 1,000 inhabitants
11.0xAffordability ratioIncome vs property price
Tax pressure : 21.2 %
Property tax in Oudsbergen
Oudsbergen levies 838 municipal surcharge points (centimes additionnels) on property withholding tax in 2026, on top of 214.52 provincial points. For a house with a cadastral income of €1,000, the 2026 property tax comes to about €1,052 a year.
It ranks 12 from the lowest among the 46 municipalities of its province.
Source: Flemish Tax Administration (Vlaamse Belastingdienst), 2026 opcentiemen. Cadastral income indexed with the 2026 coefficient (2.3), regional rate 3.97%.
Offences recorded by the police in 2024
33.8
recorded offences per 1,000 residents
Below median
Oudsbergen
33.8
Belgian median
50.1
Comparable density
47.1
This figure counts the offences recorded on the municipality's territory, divided by the number of residents. Towns that receive commuters, shoppers and visitors every day come out higher, because offences against them are counted although they do not live there. It is therefore not a measure of the risk to a resident, which is why we do not give a safety score.
Source: Belgian Federal Police, police crime statistics, offences recorded in 2024 by place of offence. Population: Statbel.
Are homes well insulated?
Flanders does not publish the breakdown of energy performance certificates by municipality as open data, so we show no percentages for Oudsbergen.
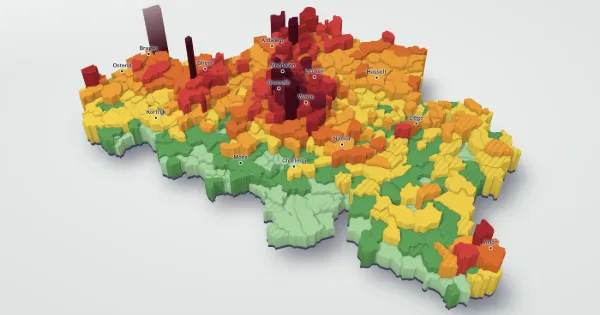
Usual price of a houseunder €150,000€150,000 to €250,000€250,000 to €350,000€350,000 to €450,000over €450,000too few sales
The usual price of a house in each municipality (Statbel). Tap or click a municipality to see its prices.
Oudsbergen on the 3D map
Every municipality in Belgium rises according to the price of its houses. Compare Oudsbergen with its neighbours and watch its prices change since 2010.
Statbel publishes sale prices neighbourhood by neighbourhood once a neighbourhood records at least 16 sales in a year. In Oudsbergen, 1 neighbourhood out of 48 has a published price for at least one year between 2022 and 2024. The others stay grey on the map, with their number of sales.
The median price is the middle one: half of the neighbourhood's sales were below it, the other half above. Each price shows the year it refers to.
Number of sales
1 to 2
2 to 3
3 to 5
5 to 26
No data
Median income
€25,424 to €31,511
€31,511 to €32,912
€32,912 to €35,183
€35,183 to €36,464
€36,464 to €40,643
No data
Average age
39 years to 42 years
42 years to 44 years
44 years to 45 years
45 years to 47 years
47 years to 55 years
No data
Households of 3 or more
20% to 32%
32% to 38%
38% to 40%
40% to 42%
42% to 53%
No data
Owner households
40% to 84%
84% to 88%
88% to 90%
90% to 93%
93% to 95%
No data
Neighbourhood
Sales
House
Apartment
Median income
Opglabbeek-Centrum - Vinkenkant - Ophoven
26 in 2024
€365,000 (2024)
not published
€30,653
Meeuwen-Centrum
13 in 2023
not published
not published
€28,904
Stegereinde - Roexeinde
11 in 2024
not published
not published
€32,229
Louwel-Kern
11 in 2023
not published
not published
€35,869
Langveld - Laer
8 in 2024
not published
not published
€36,817
Nieuwe Kempen-Kern
8 in 2023
not published
not published
€32,260
Gruitrode-Centrum
8 in 2023
not published
not published
€29,397
J.van Goor
6 in 2023
not published
not published
€39,038
Meeuwen-Verspr. Bew.-Noordwest
5 in 2024
not published
not published
€30,189
Wijshagen-Centrum
5 in 2024
not published
not published
€36,411
Ophovenderheide-Muisvennerhei
5 in 2024
not published
not published
€36,017
Neerglabbeek-Verspr. Bewoning
5 in 2023
not published
not published
€38,846
Ellikom-Centrum
4 in 2023
not published
not published
€34,622
Heikant
4 in 2023
not published
not published
€33,862
Dennenweelde
3 in 2023
not published
not published
€35,183
Meeuwen-Centrum-Noord
3 in 2023
not published
not published
€35,629
Genits
3 in 2023
not published
not published
€40,643
Meeuwen-Verspr.bew.-Noordoost
3 in 2024
not published
not published
€32,078
Water
3 in 2023
not published
not published
€38,301
Ellikom - Verspreide Bewoning
3 in 2022
not published
not published
€32,912
Show the other 28 neighbourhoods
Limobil
3 in 2024
not published
not published
€39,955
Broekkant - Hoefkant - Heikant
2 in 2024
not published
not published
€35,774
Opglabbeek-Verspr. Bew.-Noord
2 in 2023
not published
not published
€36,885
Roexeinde - Hoefkant
2 in 2023
not published
not published
€34,237
Grote Heide-Zuid
2 in 2023
not published
not published
€28,742
Hoevestraat
2 in 2023
not published
not published
€31,972
Meeuwen-Verspr. Bew.-Zuidoost
2 in 2024
not published
not published
€35,289
Zoetebeek
2 in 2024
not published
not published
€35,584
Donderslagheide
2 in 2024
not published
not published
€35,161
Louwel-Zuid
1 in 2022
not published
not published
€34,274
Opglabbeek-Centrum-Oost
1 in 2022
not published
not published
€36,464
Heikant
1 in 2023
not published
not published
€32,812
Louwel - Verspreide Bewoning
1 in 2024
not published
not published
€39,207
Uitbreiding - Broekkant
1 in 2023
not published
not published
€32,320
Gestelstraat
1 in 2024
not published
not published
€36,072
Gestel-Grote Heide
1 in 2022
not published
not published
€34,647
De Rieten
1 in 2022
not published
not published
€38,958
Plockroy
1 in 2023
not published
not published
€31,303
Solterheide
1 in 2024
not published
not published
€30,059
Roes
1 in 2023
not published
not published
€34,471
Boshoven
1 in 2023
not published
not published
€31,511
Neerglabbeek-Kern
1 in 2023
not published
not published
€32,193
Opglabbeek-Industrieterrein
not published
not published
not published
€33,235
Kleine Heide
not published
not published
not published
€32,598
Schietveld
not published
not published
not published
not published
Meeuwen-Verspr.bew.-Zuidwest
not published
not published
not published
€29,395
Dorperheide - Weekend
not published
not published
not published
not published
Gruitroderbos
not published
not published
not published
€25,424
Value a property in Oudsbergen with its address: the calculation then starts from the sales in its neighbourhood, when Statbel publishes a price for it.
Source: Statbel, sales by statistical sector, 2024, CC BY 4.0 licence. Median income: Statbel, tax income 2023. Age and households: Statbel, Census 2021.
And next door? Prices in neighbouring municipalities
Useful services around your property, offered by our partners.
Renovation plans in Oudsbergen?
One-minute request, free and with no obligation: compare up to 5 quotes from contractors and choose freely.
Get up to 5 free quotes within 24h
Certified Belgian contractors · No commitment
Partner links, at no extra cost to you.
Price Alert
Get an email when the median price changes in Oudsbergen
Frequently asked questions
In Oudsbergen, a house usually sold for €347,000 in the first half of 2026: that is the median price of all houses, from 90 sales (Statbel). For an apartment, the median price is €310,000 (year 2025).
Oudsbergen offers investment opportunities depending on your profile. 90 houses sold in Oudsbergen in the first half of 2026. Use our yield calculator to evaluate your project.
Our estimator starts from the median price of Oudsbergen and adjusts it to your property: surface, bedrooms, condition, EPC. It gives a range, free and without signing up. The real price is seen on site: an agency active in Oudsbergen can come and value it for free.
Start from the median prices published on this page, apply them to the living area, then correct for the condition of the property and its EPC rating. Have the resulting range confirmed by a professional after a visit.
No. Only an on-site valuation commits the person who signs it. An online estimate serves to frame a budget, prepare a negotiation or check that an asking price is consistent.
The EPC certificate, the invoices for the most recent works, the cadastral plan and the municipality's planning information. These documents explain the gaps between comparable properties.
Neighborhood scores for Oudsbergen are available on our site, with ratings for transport, schools, shops, green spaces and walkability. Each neighborhood receives an overall score from 0 to 100 to help you choose the ideal location.
This price rose by 8.4% compared with the first half of 2025. In Oudsbergen, a house usually sold for €347,000 in the first half of 2026: that is the median price of all houses, from 90 sales (Statbel). For an apartment, the median price is €310,000 (year 2025).
Registration duties in Oudsbergen are 3% of the purchase price. For a median house at €347,000, this amounts to approximately €6,940. Additionally, you pay notary fees (around 1%, including 21% VAT) and administrative costs. In Flanders, a reduced rate of 2% has applied since 2025 for the sole owner-occupied home.
Oudsbergen achieves a quality of life score of 67/100 (good). Transport scores 85/100. Green spaces score 59/100. Schools score 43/100. These scores are calculated from objective data on nearby amenities and infrastructure.
Based on a median house price of €347,000 and local rental market conditions, the gross rental yield in Oudsbergen is estimated at 3% to 5%. Net yield depends on taxes, maintenance and management costs. Use our yield calculator for a personalized estimate.
With a median house price of €347,000 in Oudsbergen and current mortgage rates, buying typically becomes more advantageous than renting after 7 to 10 years. Registration duties of 3% and notary fees increase the upfront cost, but long-term appreciation often offsets these expenses.
In Flanders, residents of Oudsbergen can benefit from the Mijn VerbouwPremie for energy renovations (insulation, heating, solar panels). The amount depends on your income and type of work. Also check with your municipality for additional local subsidies.