Property prices in Belgium, municipality by municipality.
Loading the map
0%
Source: StatbelMunicipal boundaries: Statbel
How much does a house cost in Belgium?
In 2025, the median price of a house in Belgium was €315,000, across 102,862 sales. For an apartment it was €250,000. In the first half of 2026, Statbel's latest release, the median price reaches €320,000 for a house and €257,000 for an apartment.
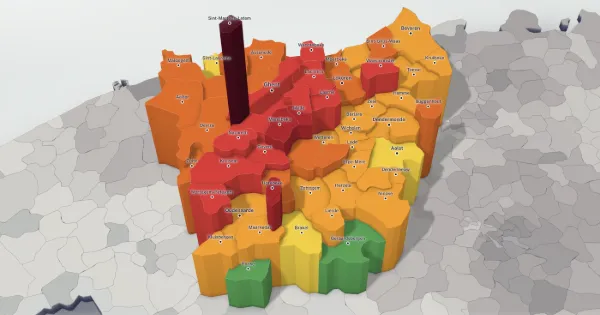
The gap between municipalities is huge: in 2025, the median house sold for €792,500 in Sint-Martens-Latem, against €95,000 in Froidchapelle.
Median price of all houses sold during the year. Only the 554 municipalities for which Statbel publishes a price (at least 16 sales) are ranked, never the estimates. Each name links to the municipality's price page.
The 10 most expensive municipalities in 2025
| Rank | Municipality | Median price | Sales |
|---|---|---|---|
| 1 | Sint-Martens-Latem | €792,500 | 128 |
| 2 | Ixelles | €785,000 | 116 |
| 3 | Lasne | €740,000 | 184 |
| 4 | Knokke-Heist | €732,500 | 324 |
| 5 | Woluwe-Saint-Pierre | €725,500 | 209 |
| 6 | Uccle | €700,000 | 333 |
| 7 | Woluwe-Saint-Lambert | €665,000 | 126 |
| 8 | Forest | €640,000 | 86 |
| 9 | Kraainem | €640,000 | 136 |
| 10 | Schilde | €618,000 | 296 |
The 10 cheapest municipalities in 2025
| Rank | Municipality | Median price | Sales |
|---|---|---|---|
| 1 | Froidchapelle | €95,000 | 80 |
| 2 | Hastiere | €100,000 | 184 |
| 3 | Quievrain | €123,000 | 69 |
| 4 | Viroinval | €123,250 | 87 |
| 5 | Colfontaine | €132,560 | 250 |
| 6 | Quaregnon | €139,000 | 163 |
| 7 | Frameries | €140,000 | 230 |
| 8 | Erquelinnes | €140,000 | 99 |
| 9 | Dour | €145,000 | 198 |
| 10 | Couvin | €145,000 | 162 |
For apartments, the most expensive municipality in 2025 is Knokke-Heist (€570,000) and the cheapest is Fontaine-l'Eveque (€121,500), out of 299 ranked municipalities.
How to read the map
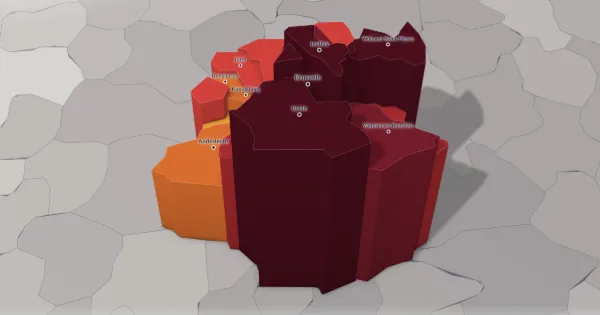
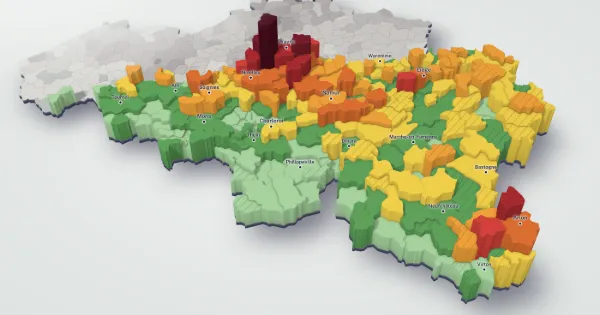
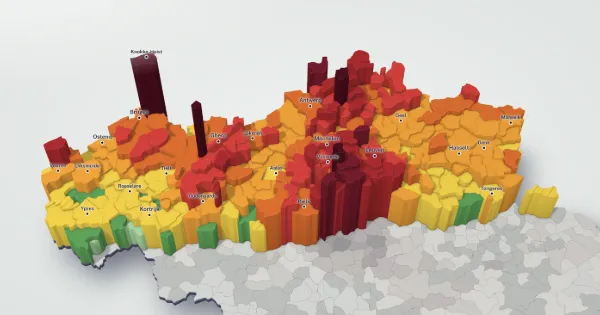
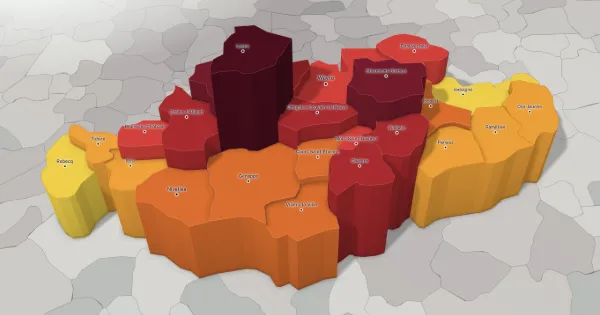
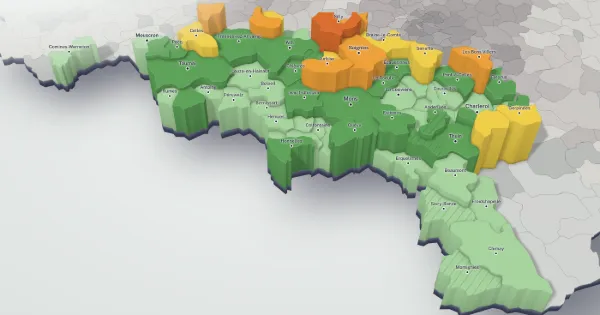
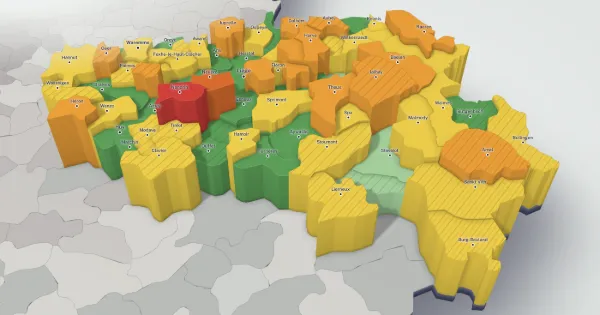
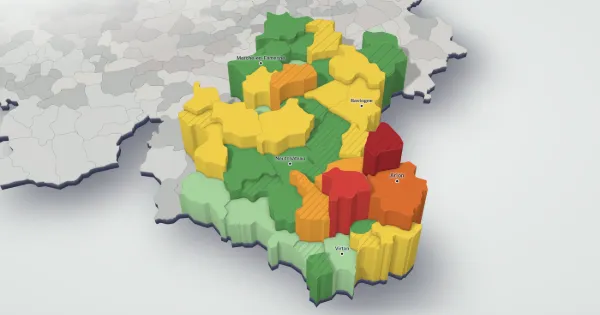
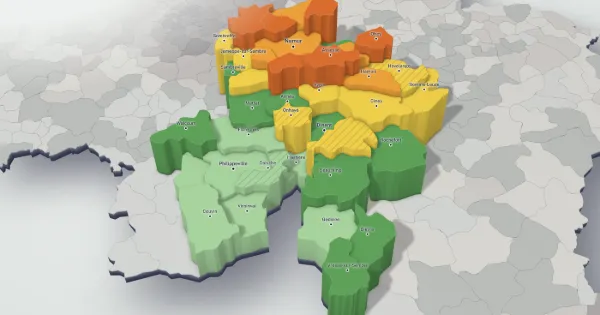
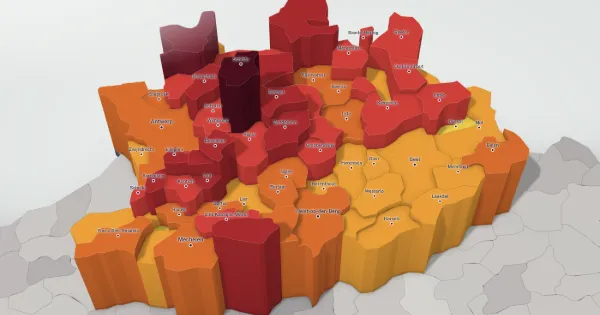
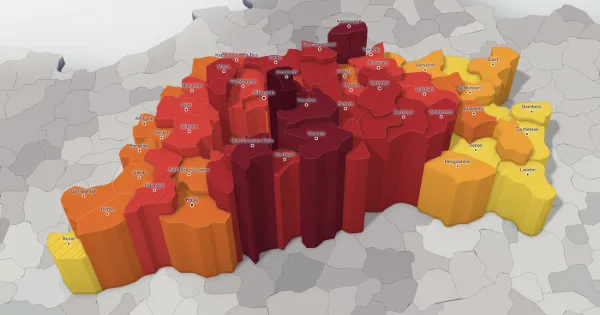
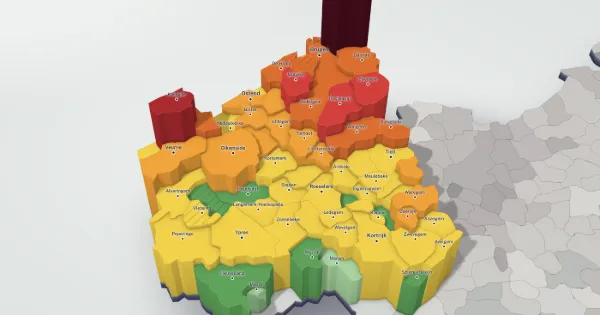
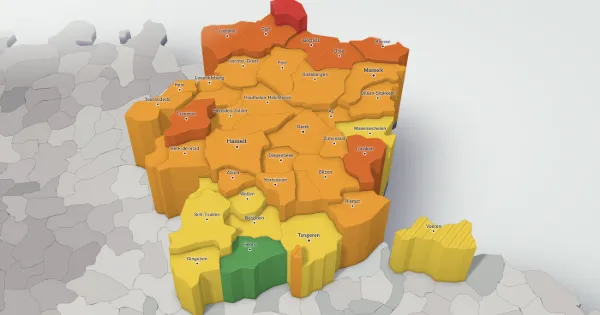
Each municipality is a block: the more its houses sell for, the taller the block. The price shown is the middle sale price of the year: half the houses sold for less, the other half for more. The colour says the same thing in nine shades, from light green for under €200,000 to very dark burgundy for €650,000 and over. Houses and apartments share the same colours and heights, so you can compare them at a glance.
The slider at the bottom picks a year, from 2010 to 2026, and the play button runs through them all. The Houses or Apartments button switches the whole map. To find a municipality, type its name in French or Dutch: the map goes there and shows its price, its change over one year and how it compares with Belgium.
For 2026, Statbel has only published the first six months so far. The map will show the full year as soon as it is out.
Municipalities with too few sales
Statbel does not publish a price when a municipality has fewer than 16 sales in a year. To leave no gaps, we estimate the price of those municipalities. On the map they keep their colour, with fine stripes. In 2025, this applies to 11 of 581 municipalities for houses and 266 for apartments.
When the municipality has a published price in another year, we start from that price and move it in line with prices in its district. For example, a municipality at €290,500 in 2025, in a district that went from €215,000 to €210,000, is estimated at about €283,500.
When the municipality has never had a published price, it takes the price of its district. If there is none, it takes its province's, then Belgium's. We round estimates to €500.
We never change a price published by Statbel. Estimates are left out of the ranking. On a municipality's card, the change over one year and the comparison with Belgium do use estimates: the 'Estimate' label says so.
For municipalities merged on 1 January 2025 (Beveren-Kruibeke-Zwijndrecht, Merelbeke-Melle, Tongeren-Borgloon and others), Statbel publishes the figures of the new municipality back to 2010. The map shows them the same way.
Every province and region on the map
Frequently asked questions
Source: Statbel, property prices by municipality, CC BY 4.0 licence. Latest release included: first half of 2026.