Property price barometer of the province of West FlandersQ2 2026
Sale prices of houses and flats, from the latest Statbel release, which covers sales up to 30 June 2026. Edition published on 1 October 2026.
Prices in the first half of 2026
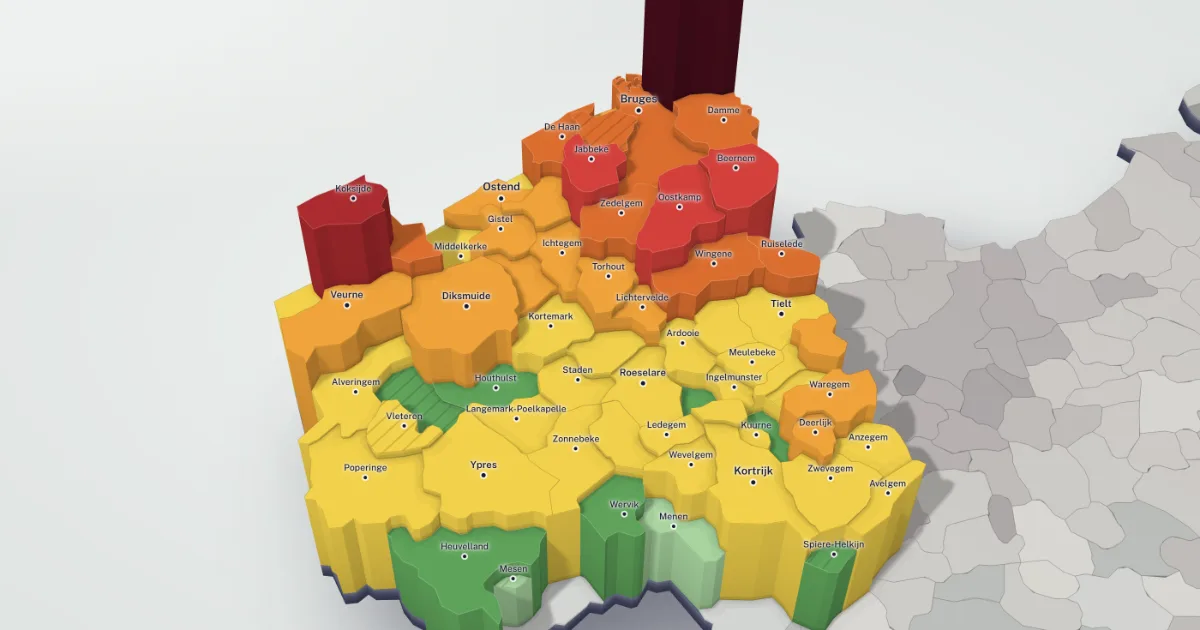
In the first half of 2026, a house in the province of West Flanders sold for a median price of €305,000. That is 3.0% more than in the first half of 2025. That price is 5% below the Belgian median of €320,000.
A flat sold for a median price of €255,000. That is 6.3% more than in the first half of 2025.
Statbel counted 6,191 house sales and 4,180 flat sales over this period.
The whole of 2025
Over the whole of 2025, a house in the province of West Flanders sold for a median price of €300,000, +3.4% compared with 2024. In 2010, that price was €180,000, so +67% since then.
For a flat: €245,000 in 2025, +1.0% compared with 2024 and +50% since 2010.
The most and least expensive municipalities in 2025
Median price over the whole of 2025, in the municipalities where Statbel published a price, which means at least 16 sales: 61 of 64 municipalities for houses.
| Rank | Municipality | Median price | Sales |
|---|---|---|---|
| 1 | Knokke-Heist | €732,500 | 324 |
| 2 | Koksijde | €447,000 | 271 |
| 3 | Jabbeke | €416,375 | 124 |
| 4 | Damme | €416,250 | 104 |
| 5 | Oostkamp | €395,000 | 241 |
| Rank | Municipality | Median price | Sales |
|---|---|---|---|
| 1 | Menin | €190,000 | 508 |
| 2 | Lo-Reninge | €210,000 | 28 |
| 3 | Wervik | €220,000 | 242 |
| 4 | Heuvelland | €225,000 | 103 |
| 5 | Poperinge | €235,000 | 203 |
| Rank | Municipality | Median price | Sales |
|---|---|---|---|
| 1 | Knokke-Heist | €570,000 | 1,103 |
| 2 | Beernem | €300,000 | 33 |
| 3 | Jabbeke | €293,450 | 25 |
| 4 | Oostkamp | €276,875 | 30 |
| 5 | Furnes | €274,500 | 45 |
| Rank | Municipality | Median price | Sales |
|---|---|---|---|
| 1 | Oostrozebeke | €179,000 | 31 |
| 2 | Roulers | €190,000 | 231 |
| 3 | Menin | €191,000 | 69 |
| 4 | Middelkerke | €210,000 | 728 |
| 5 | Gistel | €212,000 | 30 |
The barometer of the other regions and provinces
Median sale price, first half of 2026. The “Over a year” column compares with the same period of 2025.
| Area | House | Flat | Houses sold |
|---|---|---|---|
| Belgium | €320,000+1.6% over a year | €257,000+3.2% over a year | |
| Brussels-Capital | €570,000+8.6% over a year | €275,000+3.8% over a year | |
| Wallonia | €230,000-4.2% over a year | €195,000+2.6% over a year | |
| Flanders | €355,000+2.9% over a year | €268,000+5.1% over a year | |
| Walloon Brabant | €420,000+5.0% over a year | €270,000+3.8% over a year | |
| Hainaut | €189,000-0.5% over a year | €170,000+5.6% over a year | |
| Liège | €235,0000.0% over a year | €185,000+2.8% over a year | |
| Luxembourg | €255,000-5.4% over a year | €215,0000.0% over a year | |
| Namur | €255,000-1.9% over a year | €200,0000.0% over a year | |
| Antwerp | €390,000+4.8% over a year | €268,000+5.1% over a year | |
| Flemish Brabant | €415,000+5.1% over a year | €295,000+5.1% over a year | |
| West Flanders | €305,000+3.0% over a year | €255,000+6.3% over a year | |
| East Flanders | €345,000+3.0% over a year | €270,000+1.9% over a year | |
| Limburg | €325,000+4.8% over a year | €250,000+2.0% over a year |
How to read these figures
The median price is the middle price: half of the properties sold for less, the other half for more. A few very expensive sales move it less than they would move an average.
The figures come from Statbel, the Belgian statistics office, which works them out from the sales registered by the FPS Finance. They are sale prices, not asking prices from listings.
A house here means any house with two, three, four or more facades. Flats cover all sizes. Building plots are not in these figures.
For 2026, Statbel has only released the first six months so far. We therefore compare them with the first six months of 2025, never with a whole year.
Download this edition
- The barometer as a PDF, in English
- The barometer as a PDF, in French
- The barometer as a PDF, in Dutch
- All the figures of this edition as a CSV file
- Maps and press contact
How to cite this barometer
Immolytics.be, based on Statbel, property price barometer, Q2 2026.
Frequently asked questions
Source: Statbel, property prices, CC BY 4.0 licence. Calculations and layout: Immolytics.be.